Page 51 - AU_93_Annual Report
P. 51

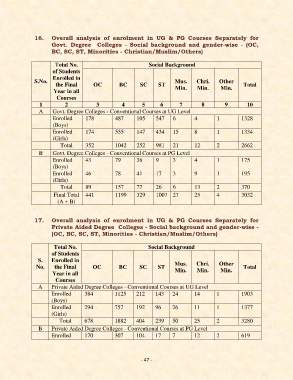
16.     Overall  analysis  of  enrolment  in  UG  &  PG  Courses  Separately  for
                       Govt.  Degree    Colleges  -  Social  background  and  gender-wise  -  (OC,
                       BC, SC, ST, Minorities - Christian/Muslim/Others)

                        Total No.                              Social Background
                       of Students
                       Enrolled in
               S.No.                                                      Mus.     Chri.     Other
                        the Final       OC         BC       SC     ST                                  Total
                       Year in all                                        Min.     Min.      Min.
                         Courses
                  1         2            3          4       5       6       7        8         9        10
                 A     Govt. Degree Colleges - Conventional Courses at UG Level
                       Enrolled      178         487      105     547    6        4         1         1328
                       (Boys)
                       Enrolled      174         555      147     434    15       8         1         1334
                       (Girls)
                          Total      352         1042     252     981    21       12        2         2662
                 B     Govt. Degree Colleges - Conventional Courses at PG Level
                       Enrolled      43          79       36      9      3        4         1         175
                       (Boys)
                       Enrolled      46          78       41      17     3        9         1         195
                       (Girls)
                          Total      89          157      77      26     6        13        2         370
                        Final Total  441         1199     329     1007  27        25        4         3032
                         (A + B)


               17.     Overall  analysis  of  enrolment  in  UG  &  PG  Courses  Separately  for
                       Private Aided Degree  Colleges - Social background and gender-wise -
                       (OC, BC, SC, ST, Minorities - Christian/Muslim/Others)

                        Total No.                              Social Background
                       of Students
                 S.    Enrolled in
                No.     the Final       OC         BC      SC      ST     Mus.     Chri.     Other     Total
                                                                                             Min.
                                                                          Min.
                                                                                   Min.
                       Year in all
                        Courses
                 A     Private Aided Degree Colleges - Conventional Courses at UG Level
                       Enrolled     384          1125     212     143    24       14       1          1903
                       (Boys)
                       Enrolled     294          757      192     96     26       11       1          1377
                       (Girls)
                          Total     678          1882     404     239    50       25       2          3280
                 B     Private Aided Degree Colleges - Conventional Courses at PG Level
                       Enrolled     170          307      104     17     7        12       2          619


                                                            - 47 -
   46   47   48   49   50   51   52   53   54   55   56