
Page 47 - AU_93_Annual Report
P. 47
Other Min. 0 0 0 0
Total 5098 6149 11247 2730 3435 6165 0 0 0 1908 2284 4192
Professional Courses
OC 787 557 1344 469 335 804 26 34 60 313 249 562
BC 331 267 598 186 156 342 9 14 23 131 118 249
SC 105 85 190 60 56 116 7 9 16 45 59 104
ST 29 26 55 20 17 37 6 8 14 14 19 33
Total 1252 935 2187 735 564 1299 48 65 113 503 445 948
Grand
Total 6350 7084 13434 3465 3999 7464 48 65 113 2411 2729 5140
(A + B)
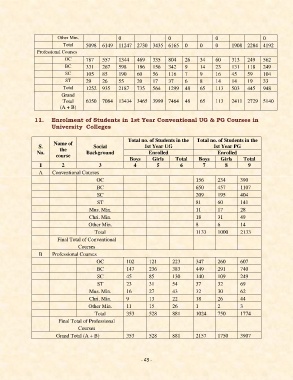
11. Enrolment of Students in 1st Year Conventional UG & PG Courses in
University Colleges
Total no. of Students in the Total no. of Students in the
Name of
S. the Social 1st Year UG 1st Year PG
No. Background Enrolled Enrolled
course
Boys Girls Total Boys Girls Total
1 2 3 4 5 6 7 8 9
A Conventional Courses
OC 156 234 390
BC 650 457 1107
SC 209 195 404
ST 81 60 141
Mus. Min. 11 17 28
Chri. Min. 18 31 49
Other Min. 8 6 14
Total 1133 1000 2133
Final Total of Conventional
Courses
B Professional Courses
OC 102 121 223 347 260 607
BC 147 236 383 449 291 740
SC 45 85 130 140 109 249
ST 23 31 54 37 32 69
Mus. Min. 16 27 43 32 30 62
Chri. Min. 9 13 22 18 26 44
Other Min. 11 15 26 1 2 3
Total 353 528 881 1024 750 1774
Final Total of Professional
Courses
Grand Total (A + B) 353 528 881 2157 1750 3907
- 43 -