
Page 42 - AU_93_Annual Report
P. 42
BC 789 805 1594 331 486 817 47 154 201 285 325 610
SC 242 320 562 89 181 270 5 32 37 82 141 223
ST 7 21 28 4 11 15 0 4 4 6 7 13
Mus. Min. 29 45 74 9 26 35 2 12 14 6 17 23
Chri. Min. 32 45 77 7 32 39 2 14 16 7 18 25
Other Min. 28 46 74 6 33 39 4 11 15 6 20 26
Total 1658 1963 3621 677 1205 1882 103 388 491 622 807 1429
Professional Courses
OC 991 927 1918 789 771 1560 73 224 297 539 503 1042
BC 1115 892 2007 839 731 1570 81 229 310 549 436 985
SC 296 298 594 221 234 455 43 81 124 89 126 215
ST 32 15 47 26 10 36 2 6 8 15 9 24
Mus. Min. 48 39 87 35 31 66 5 7 12 21 27 48
Chri. Min. 46 59 105 36 51 87 21 22 43 13 24 37
Other Min. 35 45 80 28 34 62 6 17 23 21 21 42
Total 2563 2275 4838 1974 1862 3836 231 586 817 1247 1146 2393
Grand Total (A + B) 4221 4238 8459 2651 3067 5718 334 974 1308 1869 1953 3822
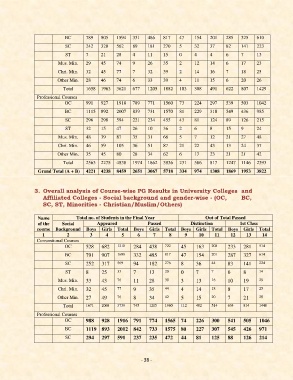
3. Overall analysis of Course-wise PG Results in University Colleges and
Affiliated Colleges - Social background and gender-wise - (OC, BC,
SC, ST, Minorities - Christian/Muslim/Others)
Name Total no. of Students in the Final Year Out of Total Passed
of the Social Appeared Passed Distinction 1st Class
course Background Boys Girls Total Boys Girls Total Boys Girls Total Boys Girls Total
1 2 3 4 5 6 7 8 9 10 11 12 13 14
Conventional Courses
OC 528 682 1210 284 438 722 45 163 208 233 281 514
BC 791 907 1698 332 485 817 47 154 201 287 327 614
SC 252 317 569 94 182 276 8 36 44 83 141 224
ST 8 25 33 7 13 20 0 7 7 6 8 14
Mus. Min. 33 43 76 11 28 39 3 13 16 10 19 29
Chri. Min. 32 45 77 9 35 44 4 14 18 8 17 25
Other Min. 27 49 76 8 34 42 5 15 20 7 21 28
Total 1671 2068 3739 745 1215 1960 112 402 514 634 814 1448
Professional Courses
OC 988 928 1916 791 774 1565 74 226 300 541 505 1046
BC 1119 893 2012 842 733 1575 80 227 307 545 426 971
SC 294 297 591 237 235 472 44 81 125 88 126 214
- 38 -