
Page 45 - AU_93_Annual Report
P. 45
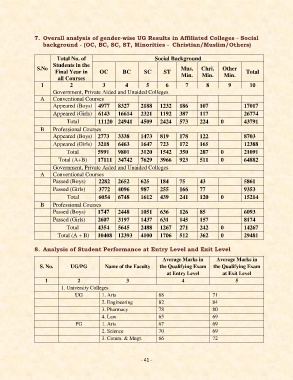
7.  Overall analysis of gender-wise UG Results in Affiliated Colleges - Social
                   background - (OC, BC, SC, ST, Minorities -  Christian/Muslim/Others)

                         Total No. of                             Social Background
                       Students in the
                 S.No                                                        Mus.    Chri.    Other
                        Final Year in      OC       BC       SC      ST                                 Total
                         all Courses                                         Min.    Min.      Min.
                  1           2             3        4        5       6        7       8        9        10
                       Government, Private Aided and Unaided Colleges
                  A    Conventional Courses
                       Appeared (Boys)  4977      8327      2188    1232    186     107                17017
                       Appeared (Girls)  6143     16614     2321    1192    387     117                26774
                             Total        11120  24941      4509    2424    573     224      0         43791
                  B    Professional Courses
                       Appeared (Boys)  2773      3338      1473    819     178     122                8703
                       Appeared (Girls)  3218     6463      1647    723     172     165                12388
                             Total        5991    9801      3120    1542    350     287      0         21091
                         Total (A+B)      17111  34742      7629    3966    923     511      0         64882
                       Government, Private Aided and Unaided Colleges
                  A    Conventional Courses
                       Passed (Boys)      2282    2652      625     184     75      43                 5861
                       Passed (Girls)     3772    4096      987     255     166     77                 9353
                             Total        6054    6748      1612    439     241     120      0         15214
                  B    Professional Courses
                       Passed (Boys)      1747    2448      1051    636     126     85                 6093
                       Passed (Girls)     2607    3197      1437    631     145     157                8174
                             Total        4354    5645      2488    1267    271     242      0         14267
                          Total (A + B)   10408  12393      4100    1706    512     362      0         29481

               8.  Analysis of Student Performance at Entry Level and Exit Level

                                                                     Average Marks in      Average Marks in
                  S. No.       UG/PG         Name of the Faculty    the Qualifying Exam   the Qualifying Exam
                                                                       at Entry Level         at Exit Level
                    1            2                    3                      4                     5
                           1. University Colleges
                                UG          1. Arts                68                     71
                                            2. Engineering         82                     84
                                            3. Pharmacy            78                     80
                                            4. Law                 65                     69
                                 PG         1. Arts                67                     69
                                            2. Science             70                     69
                                            3. Comm. & Mngt.       66                     72


                                                            - 41 -