
Page 50 - AU_93_Annual Report
P. 50
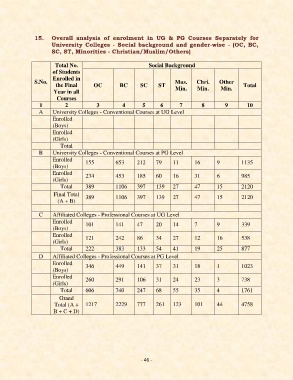
15.     Overall  analysis  of  enrolment  in  UG  &  PG  Courses  Separately  for
                       University Colleges - Social background and gender-wise - (OC, BC,
                       SC, ST, Minorities - Christian/Muslim/Others)

                        Total No.                              Social Background
                       of Students
                       Enrolled in
               S.No.                                                      Mus.     Chri.     Other
                        the Final       OC         BC       SC     ST                                  Total
                       Year in all                                        Min.     Min.      Min.
                         Courses
                  1         2            3          4        5      6       7        8         9        10
                 A     University Colleges - Conventional Courses at UG Level
                       Enrolled
                       (Boys)
                       Enrolled
                       (Girls)
                          Total
                 B     University Colleges - Conventional Courses at PG Level
                       Enrolled      155         653      212     79     11       16        9         1135
                       (Boys)
                       Enrolled      234         453      185     60     16       31        6         985
                       (Girls)
                          Total      389         1106     397     139    27       47        15        2120
                        Final Total   389        1106     397     139    27       47        15        2120
                         (A + B)

                 C     Affiliated Colleges - Professional Courses at UG Level
                       Enrolled      101         141      47      20     14       7         9         339
                       (Boys)
                       Enrolled      121         242      86      34     27       12        16        538
                       (Girls)
                          Total      222         383      133     54     41       19        25        877
                 D     Affiliated Colleges - Professional Courses at PG Level
                       Enrolled      346         449      141     37     31       18        1         1023
                       (Boys)
                       Enrolled      260         291      106     31     24       23        3         738
                       (Girls)
                          Total      606         740      247     68     55       35        4         1761
                          Grand
                        Total (A +  1217         2229     777     261    123      101       44        4758
                       B + C + D)


                                                            - 46 -