
Page 43 - AU_93_Annual Report
P. 43
ST 33 17 50 27 11 38 3 6 9 15 11 26
Mus. Min. 46 39 85 35 33 68 7 7 14 23 27 50
Chri. Min. 47 60 107 36 54 90 23 22 45 15 26 41
Other Min. 35 45 80 29 34 63 8 16 24 23 27 50
Total 2562 2279 4841 1997 1874 3871 239 585 824 1250 1148 2398
Grand Total (A + B) 4233 4347 8580 2742 3089 5831 351 987 1338 1884 1962 3846
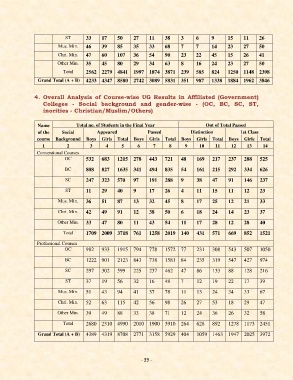
4. Overall Analysis of Course-wise UG Results in Affiliated (Government)
Colleges - Social background and gender-wise - (OC, BC, SC, ST,
inorities - Christian/Muslim/Others)
Name Total no. of Students in the Final Year Out of Total Passed
of the Social Appeared Passed Distinction 1st Class
course Background Boys Girls Total Boys Girls Total Boys Girls Total Boys Girls Total
1 2 3 4 5 6 7 8 9 10 11 12 13 14
Conventional Courses
OC 532 683 1215 278 443 721 48 169 217 237 288 525
BC 808 827 1635 341 494 835 54 161 215 292 334 626
SC 247 323 570 97 191 288 9 38 47 91 146 237
ST 11 29 40 9 17 26 4 11 15 11 12 23
Mus. Min. 36 51 87 13 32 45 8 17 25 12 21 33
Chri. Min. 42 49 91 12 38 50 6 18 24 14 23 37
Other Min. 33 47 80 11 43 54 11 17 28 12 28 40
Total 1709 2009 3718 761 1258 2019 140 431 571 669 852 1521
Professional Courses
OC 982 933 1915 794 778 1572 77 231 308 543 507 1050
BC 1222 901 2123 843 738 1581 84 235 319 547 427 974
SC 297 302 599 225 237 462 47 86 133 88 128 216
ST 37 19 56 32 16 48 7 12 19 22 17 39
Mus. Min. 51 43 94 41 37 78 11 13 24 34 33 67
Chri. Min. 52 63 115 42 56 98 26 27 53 18 29 47
Other Min. 39 49 88 33 38 71 12 24 36 26 32 58
Total 2680 2310 4990 2010 1900 3910 264 628 892 1278 1173 2451
Grand Total (A + B) 4389 4319 8708 2771 3158 5929 404 1059 1463 1947 2025 3972
- 39 -