
Page 41 - AU_93_Annual Report
P. 41
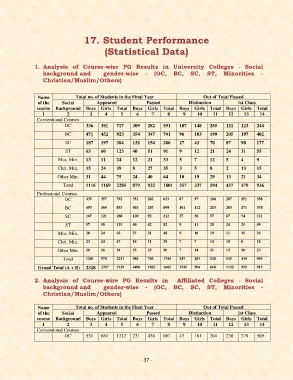
17. Student Performance

                                             (Statistical Data)


               1.  Analysis  of  Course-wise  PG  Results  in  University  Colleges  -  Social
                   background and           gender-wise  -  (OC,  BC,  SC,  ST,  Minorities  -
                   Christian/Muslim/Others)


                 Name            Total no. of Students in the Final Year              Out of Total Passed
                 of the    Social        Appeared             Passed            Distinction         1st Class
                course  Background  Boys  Girls  Total  Boys  Girls  Total  Boys  Girls  Total  Boys  Girls  Total
                   1         2        3      4     5      6     7      8      9    10     11    12     13     14
                Conventional Courses
                            OC       336   381    717   309    282   591    107   148    255   121    123   244
                            BC       471   452    923   354    347   701    96    103    199   205    197   402
                            SC       187   197    384   132    154   286    27    43     70    87     90    177

                            ST       63    60     123   40     51    91     9     12     21    24     31    55
                         Mus. Min.   13    11     24    12     21    33     5     7      12    5      4     9
                         Chri. Min.   15   24     39    8      27    35     3     5      8     2      13    15
                         Other Min.   31   44     75    24     40    64     10    19     29    13     21    34

                           Total     1116  1169   2285   879   922   1801   257   337    594   457    479   936
                Professional Courses
                            OC       435   357    792   351    282   633    87    97     184   207    151   358

                            BC       493   360    853   403    287   690    101   112    213   203    171   374
                            SC       167   121    288   120    92    212    27    30     57    67     54    121
                            ST       57    58     115   40     42    82     9     11     20    24     25    49
                         Mus. Min.   38    24     62    27     21    48     9     10     19    11     15    26
                         Chri. Min.   23   24     47    18     11    29     7     7      14    10     8     18
                         Other Min.   28   26     54    25     25    50     7     14     21    13     10    23

                           Total     1241   970   2211   984   760   1744   247   281    528   535    434   969
                 Grand Total (A + B)   2328   2357   2139   4496   1863   1682   3545   504   618   1122   992   913

               2.  Analysis  of  Course-wire  PG  Results  in    Affiliated  Colleges  -  Social
                   background and           gender-wise  -  (OC,  BC,  SC,  ST,  Minorities  -
                   Christian/Muslim/Others)

                 Name            Total no. of Students in the Final Year              Out of Total Passed
                 of the    Social        Appeared             Passed            Distinction         1st Class
                course  Background  Boys  Girls  Total  Boys  Girls  Total  Boys  Girls  Total  Boys  Girls  Total
                   1         2        3      4     5      6     7      8      9    10     11    12     13     14
                Conventional Courses
                            OC       531   681    1212   231   436   667    43    161    204   230    279   509


                                                            - 37 -